Chapitre 16
Activité 3 - Activité expérimentale
30 min
Modéliser une onde mécanique avec Python
Ressource affichée de l'autre côté.
Faites défiler pour voir la suite.
Faites défiler pour voir la suite.
Problématique de l'activité
Un langage de programmation permet de simuler la propagation d'une onde mécanique périodique progressive.
Quels sont les paramètres qui influencent la représentation d'une onde
mécanique progressive périodique ?
Ressource affichée de l'autre côté.
Faites défiler pour voir la suite.
Faites défiler pour voir la suite.
Ressource affichée de l'autre côté.
Faites défiler pour voir la suite.
Faites défiler pour voir la suite.
Doc. 1Matériel nécessaire
- Un ordinateur avec Python 3 installé ;
- Un éditeur de programme (comme IDLE, PYZO, EduPython, etc.) avec les bibliothèques matplotlib et numpy installées.
Ressource affichée de l'autre côté.
Faites défiler pour voir la suite.
Faites défiler pour voir la suite.
Doc. 2Code Python
import numpy as np
import matplotlib.pyplot as plt
from matplotlib.animation import FuncAnimation

fig, ax = plt.subplots(figsize=(10, 5))
ax.set(xlim=(0,3), ylim=(-1, 1))
plt.xlabel('X (cm)', fontsize=16)
plt.ylabel('Y',fontsize=16,rotation = 'horizontal')
x = np.linspace(0,3,300)
t = np.linspace(1,2,300)
X2,T2 = np.meshgrid(x,t)

#Paramètres de l'onde
A = 0.9
v = 2
T = 0.25
k = 2*np.pi/(v*T) # vecteur de l'onde

F = A*np.sin(2*np.pi/T*T2-k*X2) # F fct de 2 variables
line = ax.plot(x,F[0,:], color='r',lw=2)[0]

def animate(i):
    line.set_ydata(F[i,:])
    line.set_xdata(x)
anim = FuncAnimation(fig, animate, interval=50, frames=300)
plt.show()
Ressource affichée de l'autre côté.
Faites défiler pour voir la suite.
Faites défiler pour voir la suite.
Doc. 3Capture d'écran de l'onde simulée

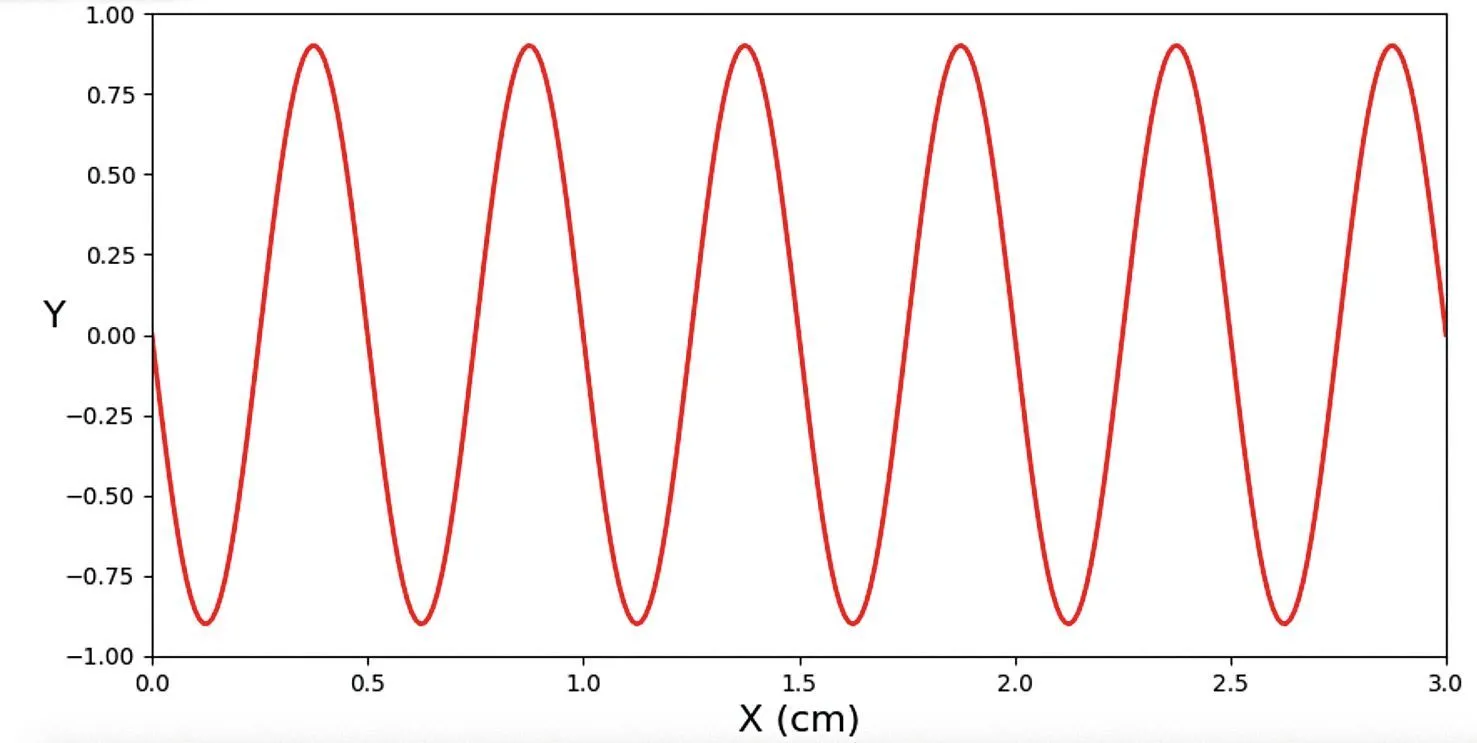
Cette animation est constituée d'une suite d'images (tel un dessin animé) espacées de 50 ms.
Ressource affichée de l'autre côté.
Faites défiler pour voir la suite.
Faites défiler pour voir la suite.
Doc. 4Capacité mathématique
Une onde sinusoïdale se propageant dans le sens des x croissants à la célérité v peut être représentée par la fonction mathématique suivante :
\begin{aligned} s(x, t) &=A \cdot \cos (\dfrac{2 \pi}{T} \cdot(t-\dfrac{x}{v})+\Phi) \\ s(x, t) &=A \cdot \cos (2 \pi(\dfrac{t}{T}-\dfrac{x}{\lambda})+\Phi). \end{aligned}
Avec \lambda=T \cdot v.
Ressource affichée de l'autre côté.
Faites défiler pour voir la suite.
Faites défiler pour voir la suite.
Questions
Compétence(s)
MATH : Utiliser un langage de programmation
1. Doc. 2 Exécuter le code.
Attention : La console python présente sur le site permet de faire l'activité mais ne permet pas d'observer le déplacement de l'onde. Pour profiter pleinement du code proposé, il faut recopier le code sur un ordinateur ayant une console python installée.
2. Doc. 3 Déterminer graphiquement l'amplitude et la longueur d‘onde de l'onde.
3. En examinant le code, indiquer dans quelles variables la valeur de l'amplitude et de la période temporelle de l'onde sont stockées.
4. En modifiant la valeur de la période temporelle et celle de l'amplitude de l'onde, étudier leur influence sur la représentation de l'onde.
5. À l'aide de la relation entre période temporelle, longueur d'onde et célérité, retrouver la valeur numérique de la longueur d'onde de l'onde présentée dans le doc. 3.
6. Doc. 4 Identifier dans le code la ligne correspondant au calcul de chaque valeur de la fonction d'onde à deux variables s(x, t).
Ressource affichée de l'autre côté.
Faites défiler pour voir la suite.
Faites défiler pour voir la suite.
Synthèse de l'activité
Quelles sont les limites de la représentation numérique de l'onde ? Pourquoi n'est-il pas réaliste d'envisager la propagation réelle d'une onde avec une amplitude constante au cours du temps ?
Une erreur sur la page ? Une idée à proposer ?
Nos manuels sont collaboratifs, n'hésitez pas à nous en faire part.
j'ai une idée !
Oups, une coquille
